Happy Planet Index Report
Download the 2026 Happy Planet Index Report
Download the reportNEW: The 2026 Happy Planet Index is live
Explore the data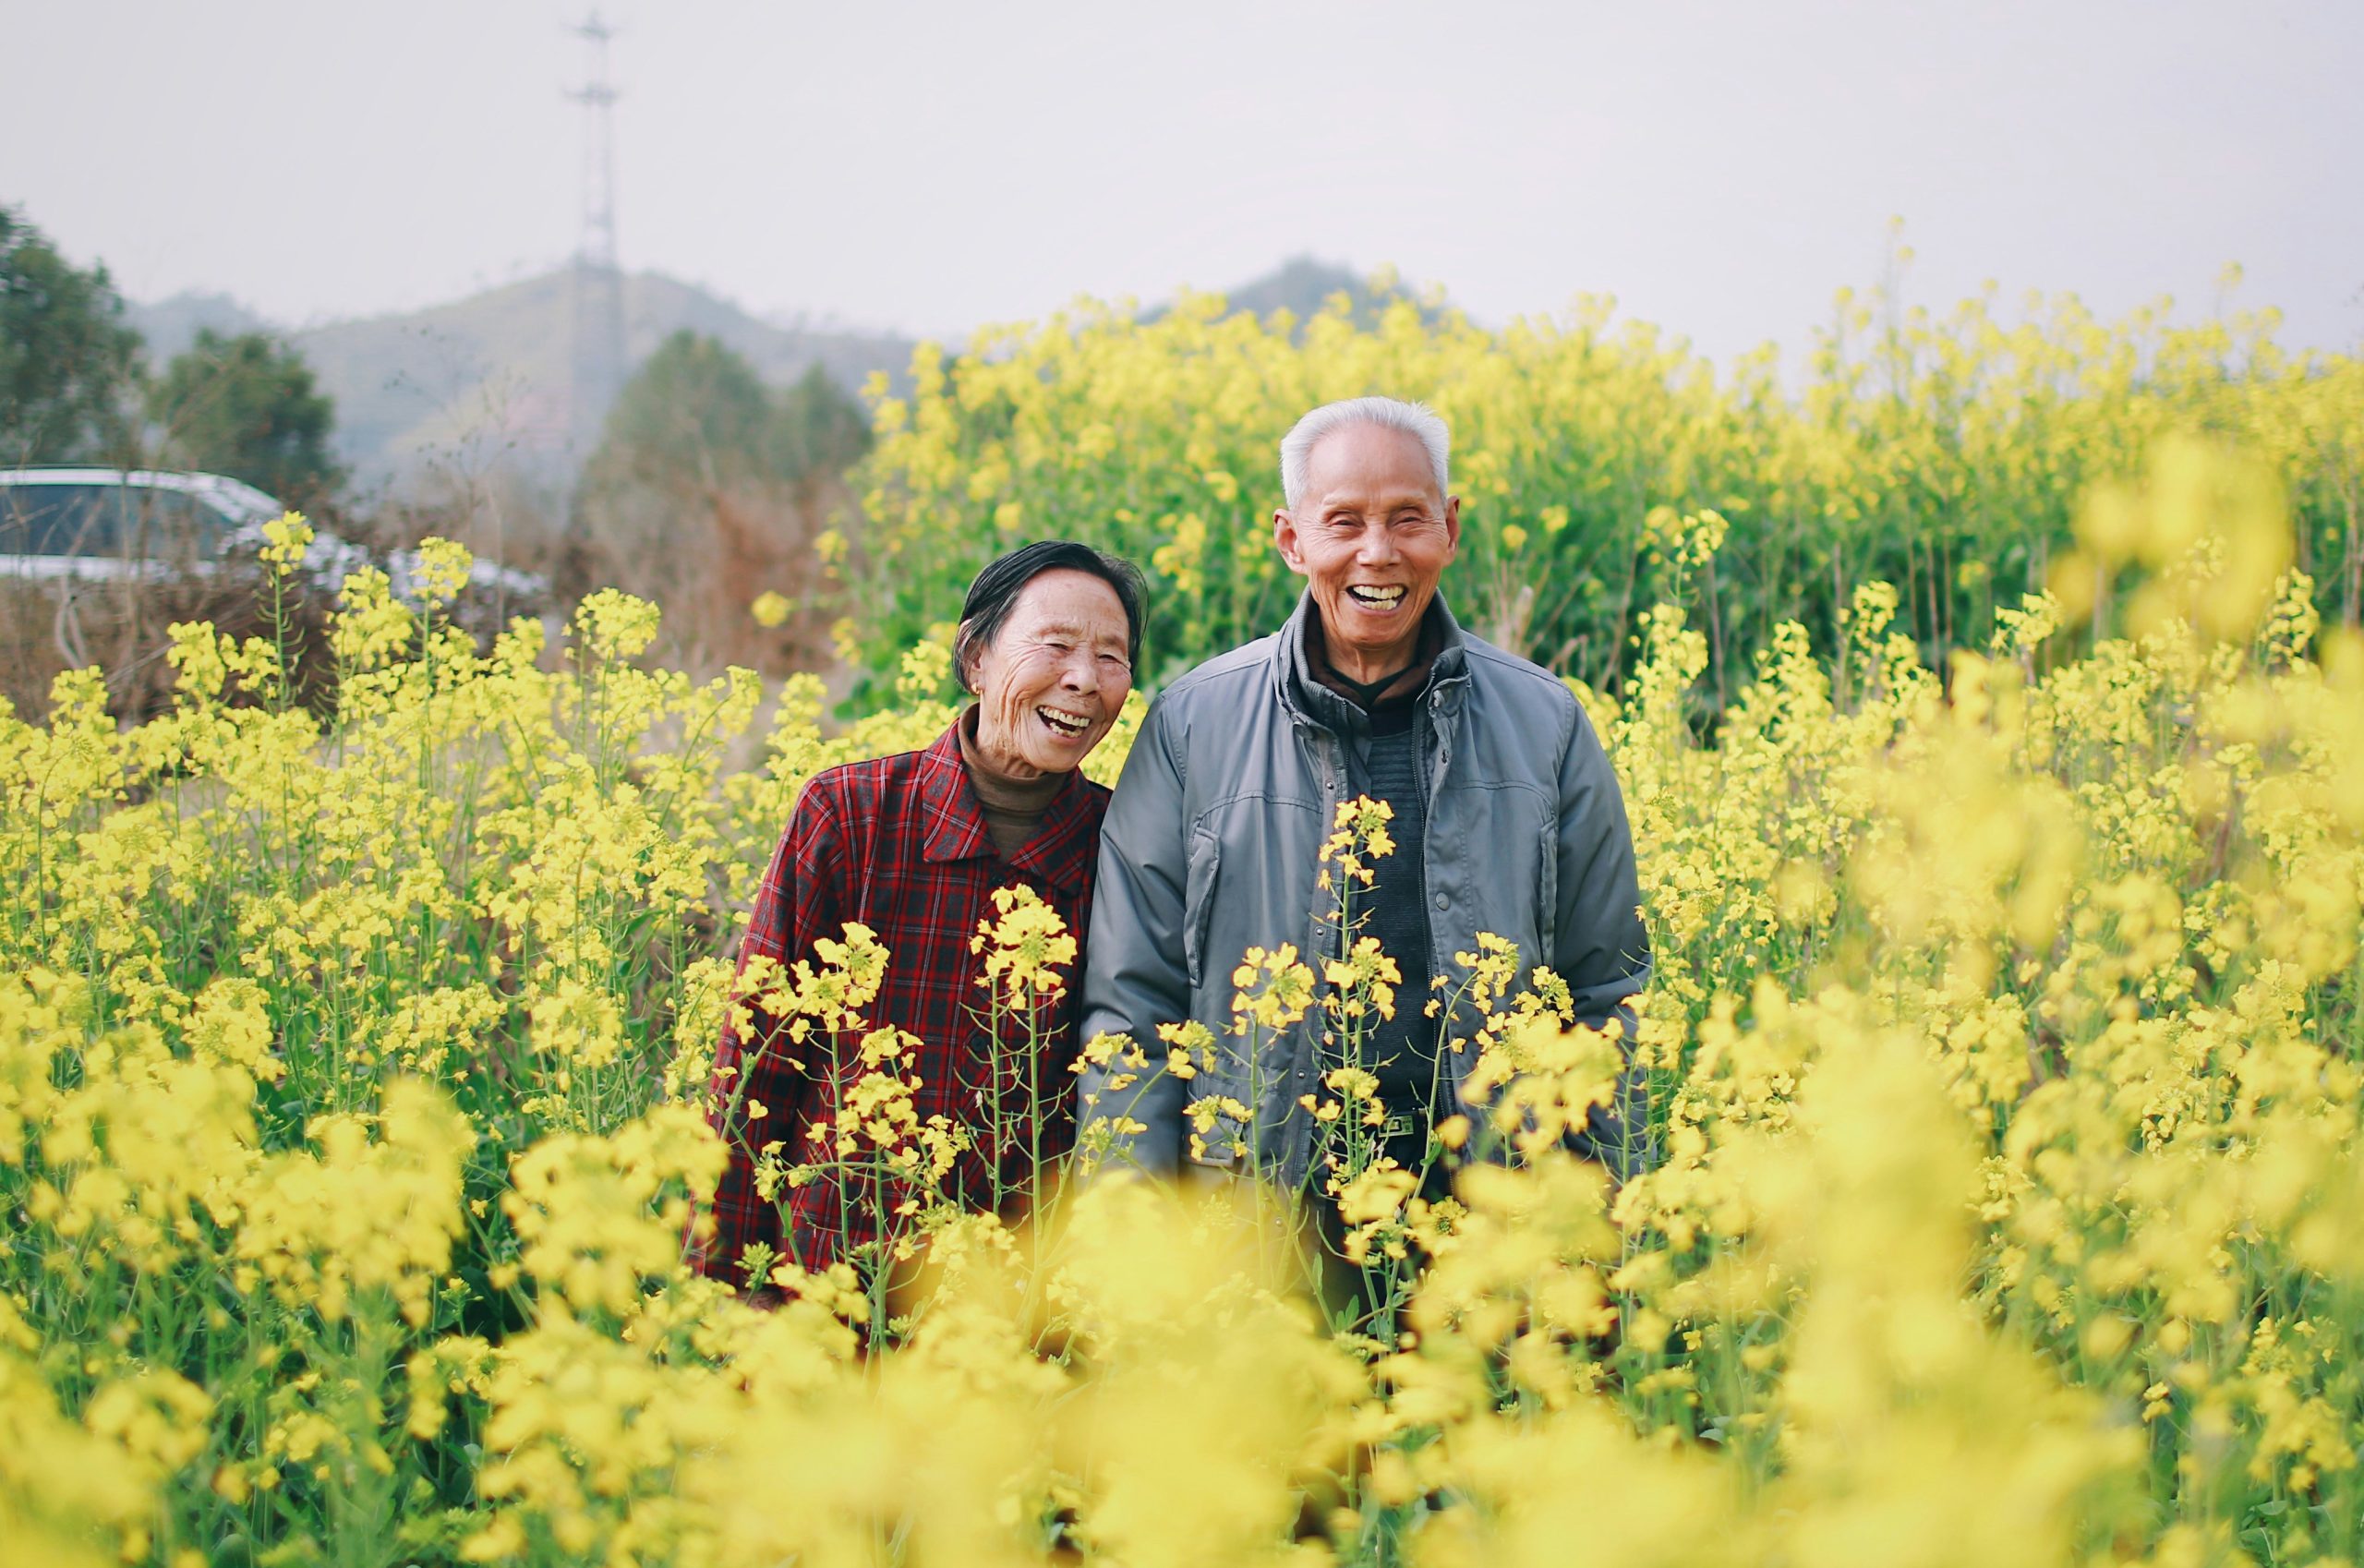
The Happy Planet Index is a measure of sustainable wellbeing, evaluating countries by how efficiently they deliver long, happy lives for their residents using our limited environmental resources.
The Happy Planet Index helps to answer the question

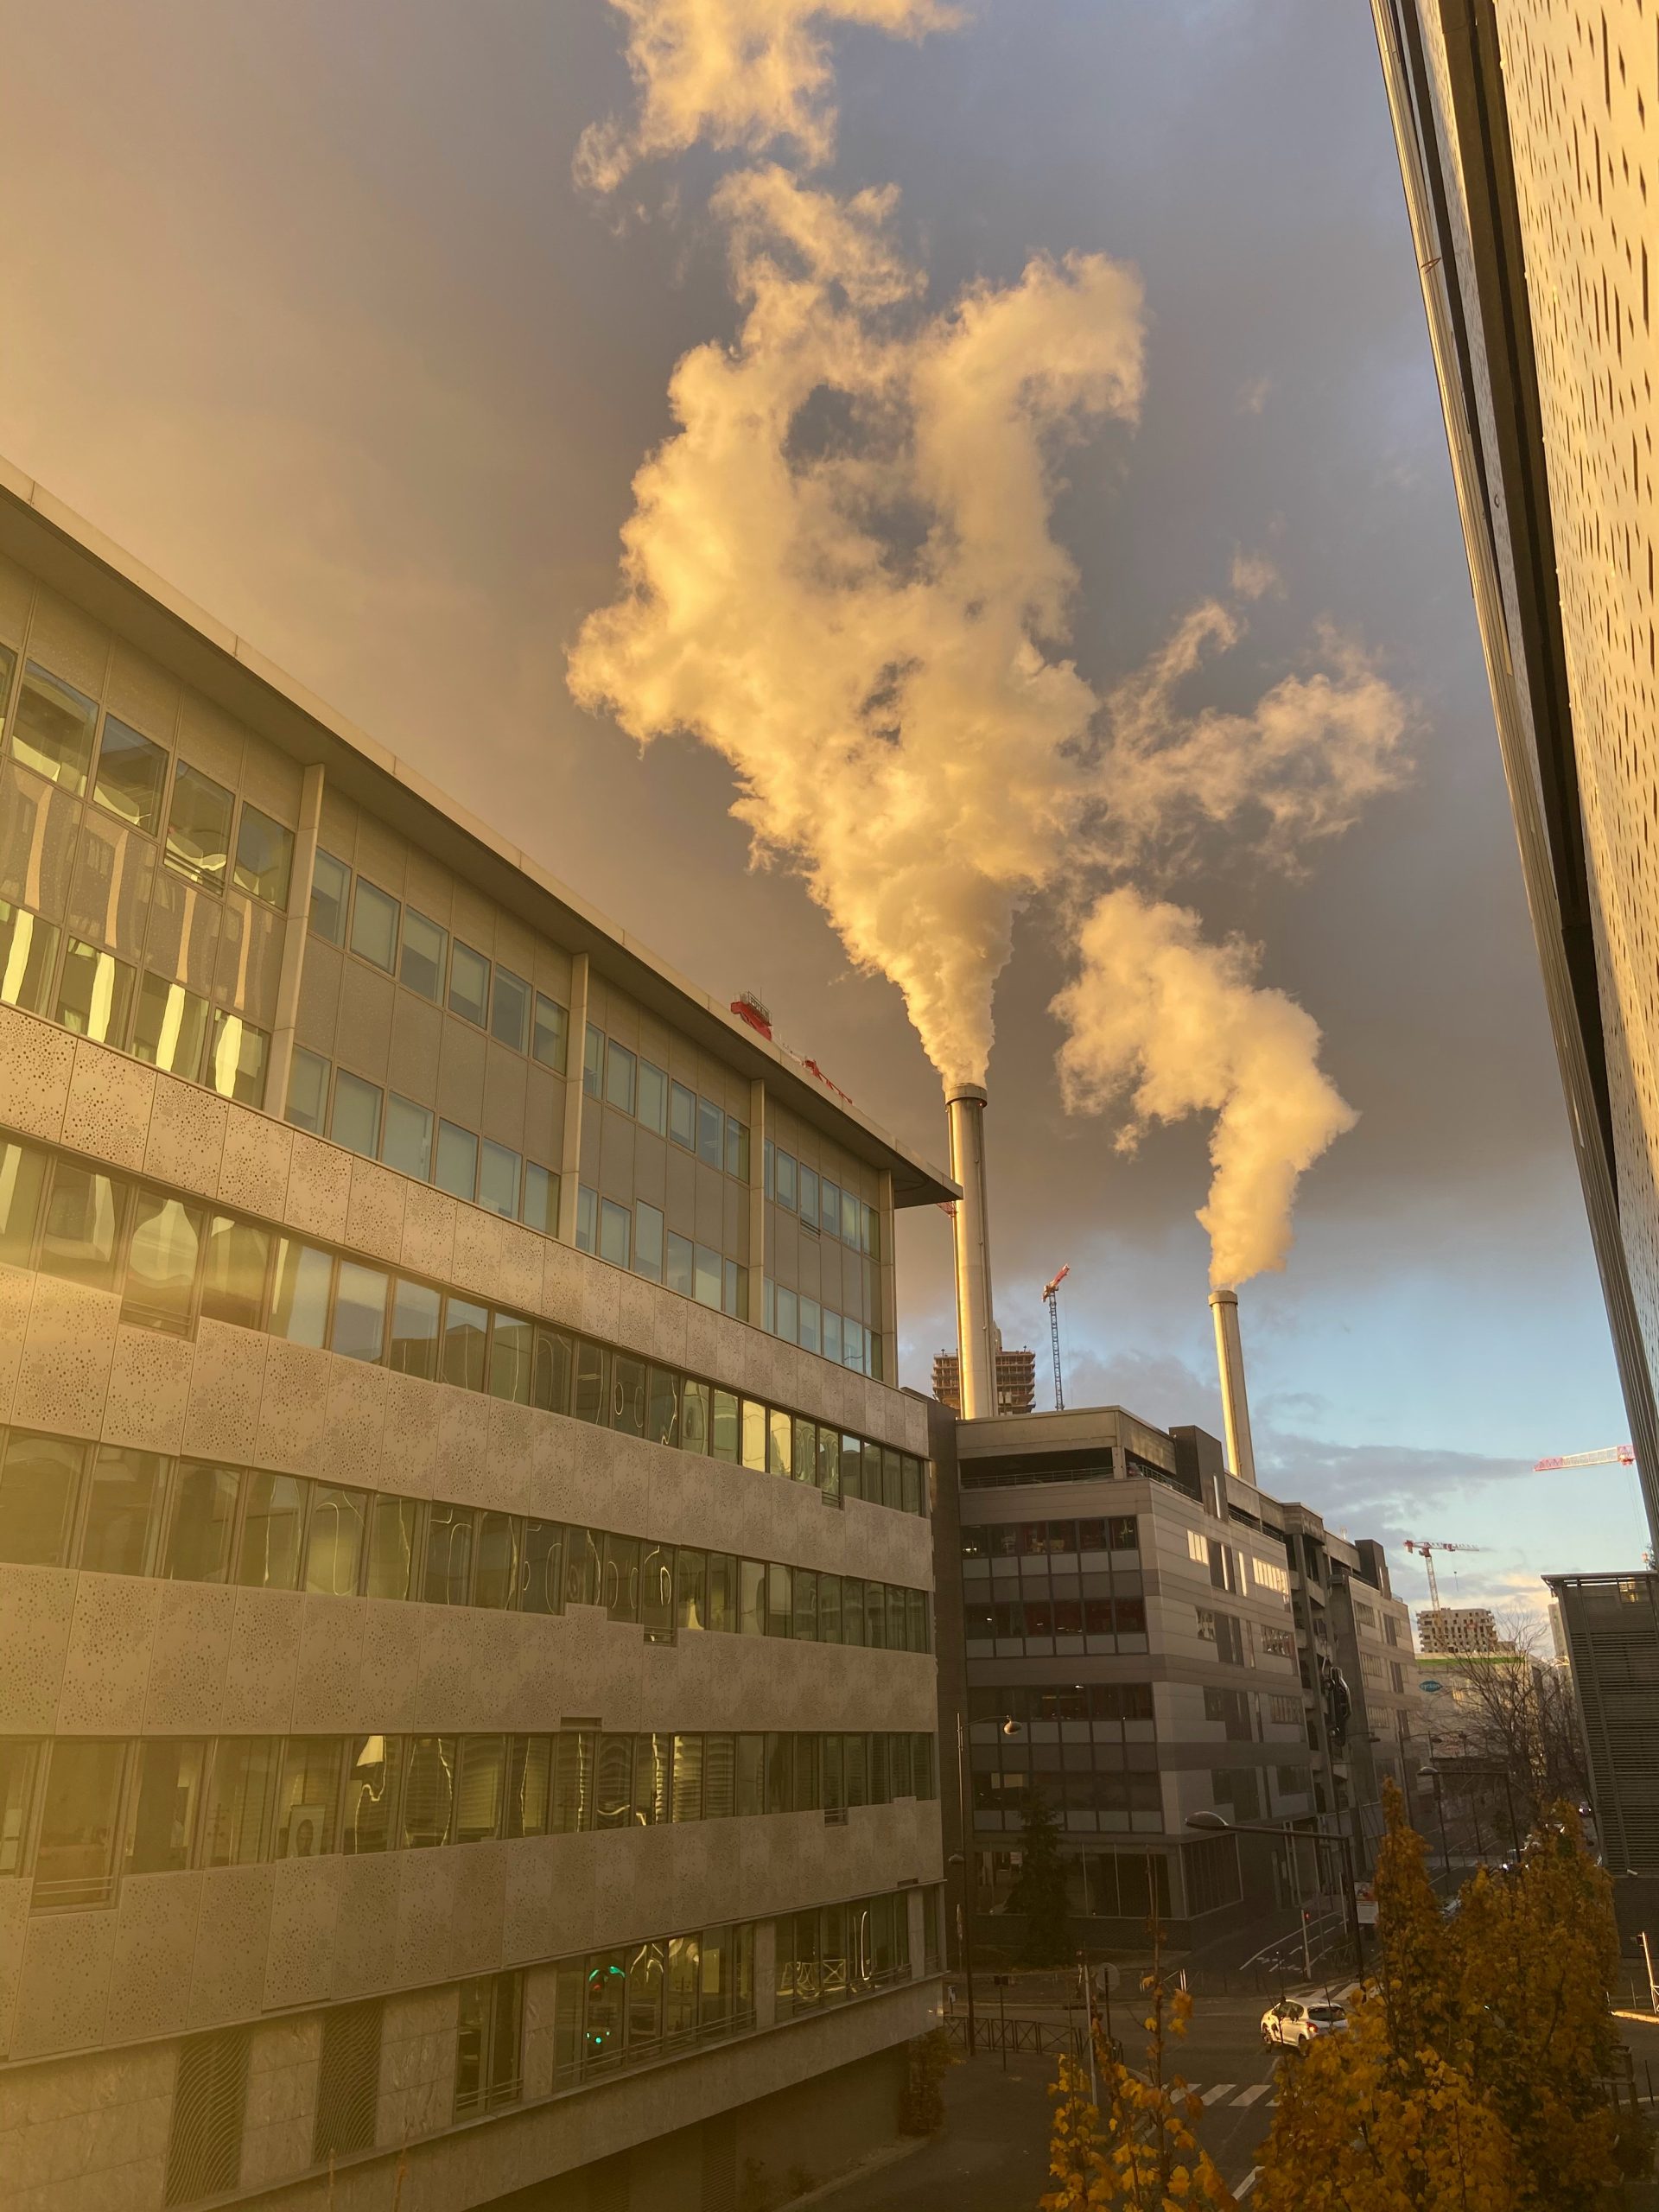
The crises we face: persistent inequalities, accelerating climate breakdown, and rapid biodiversity loss are interconnected and stem from the same core problem: our economies are structured, governed, and measured to promote economic growth over collective wellbeing.
Too often governments prioritise accelerated economic growth above all other concerns. They lose sight of what truly matters – long, happy, sustainable lives for people around the world.
No two nation’s economic systems are exactly the same, but they all operate on a similar logic: increasing Gross Domestic Product (GDP) is inherently good because it increases everyone’s wellbeing and prosperity.
In reality, GDP growth on its own does not mean a better life for everyone, particularly in countries that are already wealthy. It doesn’t take into account inequality, the things that really matter to people like social relations, health, or how they spend their free time, and crucially, the planetary limits we are up against.
Tim Jackson, Chasing Progress

Research suggests that in most reasonably developed countries, material circumstances such as wealth and possessions play only a small role in determining levels of wellbeing (some psychologists say it’s only 10 percent).
Of course, increased consumption (for example of healthy food, quality healthcare, and leisure activities) brings wellbeing up to a point, but beyond a certain point, having added income or consuming more does not lead to any more increases in wellbeing – this is what economists call “diminishing returns”.
The Five Ways to Wellbeing are evidence-based positive actions that anyone can take to promote their own wellbeing. They have been used very widely in public mental health settings globally and the great thing about them is that none of them have to cost the earth.
The Five Ways to Wellbeing are:
You can reflect on how well you are doing with the Five Ways by taking our personal HPI test.

The Happy Planet Index measures what truly matters to us – our wellbeing in terms of long, happy, and meaningful lives – and what matters to the planet – our rate of resource consumption.
Rather than pursuing growth at all costs, even if it’s harmful to wellbeing or sustainability, what if we strived to create wellbeing and pursue sustainability, no matter the impact on growth?
Over the last eighteen years, the Happy Planet Index has highlighted which countries are most successful at supporting long, happy lives with low carbon footprints – and puts forward a vision of how we can all do the same.
The challenge now is how we can turn this vision into meaningful action.
Download the 2026 Happy Planet Index Report
Download the report
Download the data
Download the data
Download the methodology paper
Download the methodology paper© Hot or Cool Institute gGmbH | All rights reserved ![]()